11 minutes
Don’t allow rate outlooks and price risk expectations to drive the duration decision. Answer these six questions instead.
This article was reprinted with permission from Darling Consulting Group.
“I am really concerned about these long assets!” –At least one member on your board
The year was 1996, and I was in an asset/liability committee meeting early in my career. The topic of the conversation was interest rate risk, and someone shared a graph illustrating historical trends for the 30-year mortgage rate. At the time the rate was approaching a 30-year low of 7%. Thirty-year U.S. Treasury bonds yielded 7.5%.
The objective with this illustration was to help rationalize their decision to not follow a strategy recommendation we had made in the two previous ALCO meetings, which was to purchase government-sponsored enterprise mortgage collateralized investments funded with short-term borrowings. Despite managing a balance sheet that was clearly asset-sensitive and demanded long-duration assets, their view was that purchasing long-duration assets was an unwise strategy given rates were near the historical low.
“You’re too young to remember when mortgages were at 15%. It wasn’t pretty.”
I can hear it like it was yesterday. At the time, some form of this statement was expressed on more than a few occasions early in my career—clearly intended to suggest that I was uninformed to historical context and too inexperienced to properly help navigate through the prevailing economic environment. To this day, even after spending 25 years advising the industry in asset/liability management, I continue to fight an uphill battle to convince financial institutions when added duration is a worthwhile consideration as part of their balance sheet strategy.
Given short-term market rates are effectively at their lower-bound level and long-term rates remain at levels not observed since before the 1960s, it is undeniable that long-duration assets should be viewed with skepticism and cynicism. However, risk is a relative term and should be examined accordingly.
This article is not written to make an argument for or against added duration (that should be determined by your specific balance sheet and business conditions), but rather to quell tendencies to allow rate outlooks and related price risk expectations to drive the decision to either accept or reject the notion of adding duration to your bond portfolio. In this regard, we strongly recommend ALCOs contemplate the following questions.
How Much Should Reported Unrealized Gains/Losses Matter?
Regulatory accounting principles purposefully exclude unrealized gains/losses from capital ratios unless investments are classified as “trading” under the ASC 320 GAAP accounting rule (formerly SFAS 115). It is important to also note that given the loan and deposit intermediary function of community banking institutions, very few drive their profit and loss statements through trading activities (active or otherwise), and thus they rarely experience any regulatory capital penalty (or benefit) due to interest rate risk-related market-to-market volatility in the bond portfolio.
Notwithstanding, unrealized gains/losses in the investment portfolio garner much attention each quarter when reported in management and/or board meetings. Interestingly, seldom quantified and assessed is the accumulated income effect of these asset holdings, even though income does in fact have a direct impact on capital accumulation and your regulatory ratios.
Institutions concerned with tangible equity should be careful not to overweight the impact of price risk in their investment decision. Historical trends in stock prices highlight an inverse relationship between market value adjustments in the bond portfolio and market cap valuations. The reason? Valuations elsewhere in the balance sheet that are not required to be reported under GAAP either mitigate or mute unrealized losses in the bond portfolio. Further, unrealized losses are correlated to higher rate conditions, and higher rates are typically associated with stronger economic conditions and opportunities for growth in both assets and income.
Will Price Sensitivities Change Your Comfort Level With Liquidity and Capital Adequacy?
While concerns for reported unrealized gains/losses should be distinguished from those concerns related to net interest income volatility, market-to-market adjustments in your bond portfolio will affect liquidity and possibly capital adequacy, regardless of accounting treatment. Price risk should be analyzed accordingly.
Assuming credit and asset quality conditions do not threaten the institution’s “well capitalized” designation, depreciation should not lead to capital depletion vis-à-vis deleveraging mandates and forced asset sales. In this regard, bond depreciation primarily affects liquidity by virtue of the institution’s collateral values. Collateralized borrowing is a widely accepted funding tactic and often much less expensive than holding cash, building a conservative cash flow ladder or planning for bond sales. Potential changes in collateral values and related borrowing capacities are best captured and analyzed as part of a contingency liquidity risk modeling process.
Separate from both regulatory and GAAP capital ratios, the tangible equity ratio does include market-to-market adjustments. This is a ratio prioritized in the investor community and used for public institutions to more fully understand their ability to withstand losses. For these institutions, potential shocks to bond valuations should be captured and measured as part of the institution’s capital stress testing exercises.
If duration-related price risk does not trigger meaningful concerns in either of these areas, one should strongly question the degree to which it should be the determining factor behind a “yes” or “no” decision to “go long” on duration in the bond portfolio.
Does Adding Duration Improve Potential Earnings Sensitivities or Exacerbate It?
Each quarter, balance sheet models are built for purposes of understanding the potential for income sensitivity as market rates change. Generally, if a balance sheet is asset-sensitive, its asset base exhibits shorter duration characteristics than its funding base, and thus influences margin income benefits from higher rate conditions and downward margin performance pressures under lower rate conditions. A liability-sensitive balance sheet exhibits the opposite characteristics. Ultimately, this exercise reveals the fact that your balance sheet already has an embedded bet on market rates.
Webster’s dictionary defines “risk management” as the “technique or profession of assessing, minimizing and preventing accidental loss to a business, as through the use of insurance, safety measures, etc.”
If we follow this definition in practice, an institution that is asset-sensitive (short assets/loan liabilities) should willfully add longer duration assets to the balance sheet to help minimize and prevent the accidental loss of income to lower rate conditions, even if their market rate bias is to rising rates.
Be careful with your personal or institutional rate biases. Understand that market rate predictions (even professionally outsourced forecasts) are more often incorrect than otherwise because, while they may accurately guess market rate direction, typically they fail in predicting the timing, magnitude and slope of market rate changes.
Further, it is important to remember that no one ever wishes to experience a situation where they collect on an insurance policy. In this regard, boards and ALCOs should be careful not to be overly critical when unrealized losses mount or transaction spreads narrow. Ironically, they should hope and wish for these results, because it implies that market rates are higher and the pre-existing asset-sensitive balance sheet is likely influencing stronger margin/income performance. This is a counterintuitive concept but a very important one.
More simply, the main objective of a community banking institution should be to establish consistent earnings growth through its core loan and deposit function, not vis-à-vis market rate speculation. The investment portfolio should be viewed as part of the institution's “wholesale balance sheet,” whose primary function should be to act as an offset to the risks embedded in the “core balance sheet.” If forced to utilize the investment portfolio as a vital mechanism to drive income, a more serious underlying issue likely lies within the core functions of the organization.
What Is the Benefit of Yield Curve Slope and Rolling Down The Curve?
Bond math theory proves that as the life of a bond shortens, market values converge toward book values and unrealized gains/losses decline toward zero. This implies that to the degree that a bond is held in the portfolio and not sold, pricing volatility will never negatively impact regulatory capital. Meanwhile, the income that is generated from a bond trade accumulates over time as permanent tier 1 capital.
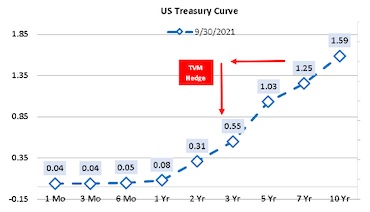
This concept of “walking down the curve” acts as a natural hedge in the time value of money equation. In the example below, the slope of the curve at quarter end September 2021 offers 70 basis points of protection between the seven-year U.S. Treasury bond and the three-year UST bond. Should the three-year UST bond stay within 70 basis points of its current rate level over the next four years, any gains/losses in the seven-year UST will be protected against price depreciation. The opportunity cost of locking up cash will be minimal compared with investing in a “short/conservative” duration alternative. This appears to be favorable when compared to the risk/reward trade-offs associated with being in three-year USTs versus cash or 30-day Treasury bills.
How Does the Risk/Reward of a Short-Duration Strategy Compare?
If your ALCO is saying “no” to long-duration bonds, then implicitly you must be saying “yes” to something else. If the answer to that question is either cash or shorter-duration investments (and not loans), there are a few things to contemplate.
First, the yield curve is steep. The slope between two-year USTs and 10-year USTs averaged roughly 120-125 basis points since early October. Compare that to the three- and five-year averages of 57 basis points and 77 basis points, respectively, and one can argue that there is limited room for long rates to move higher. The 10-year average for 2/10 slope is 145 basis points. Therefore, unless you expect to observe a meaningful inversion in the curve, opportunities to buy investments at higher yields soon become more uncertain.
Can your balance sheet tolerate the opportunity cost and, if so, for how long? This is an especially important question for leaders of financial institutions today given the outlook for margin compression, the loss of COVID-related income sources realized during 2020 and 2021, diminished recoveries of large provisional expenses made at the onset of shelter-in-place mandates, and sizable increases in expected staffing and personnel costs. In the absence of strong loan growth, most 2022 budgets are facing challenges to replicate prior year earnings.
If the decision is to invest in short-duration alternatives at lower yields, understand that added volume is required to generate break-even income to long-duration bonds. For example, investors would have to buy 2.25 times the volume on three-year USTs (at 0.55%) to generate the same income as seven-year USTs (at 1.25%). This locks up more cash liquidity and leverage capital that you might rather earmark for lending activity if growth opportunities surprise to the upside.
Lastly, while the three-year UST has less price risk compared to the seven-year UST, remember that the added volume translates into a larger hit to tangible equity and OCI after market-to-market adjustments are made. In other words, to match the same income goal, the benefit from a capital and OCI standpoint may not be as great as one might think.
Why View the Bond Portfolio Differently Than the Loan Portfolio?
Given margin income pressures, competition for loans has heated up. In this regard, institutions have been forced to consider longer resets and lower rates in the commercial sector and/or tolerate increases in fixed-rate residential mortgages to satisfy loan growth objectives. While these assets will also oscillate in value as market rates change, the hindsight scrutiny the bond portfolio receives is non-existent given that market-to-market accounting rules do not apply to loans that are not held for sale. If value sensitivity is truly important, it shouldn’t matter which assets and liabilities we are discussing. Ultimately, this leads to an economic value of equity approach to managing your balance sheet, a method we do not advocate given the lack of correlation with income growth and stability, and therefore, the true net worth of the organization.
Listen to What Your Balance Sheet Tells You
Making investment duration decisions based on market rate outlook may quite possibly be the most common mistake we observe in our industry. Historically, most leaders of financial institutions have been most likely to execute strategies after the markets have already adjusted risk premiums. I can confidently state that if any of our readers had a high level of consistent success predicting the markets, well simply … you wouldn’t be readers of our material. While it is fun to share perspectives and make bets with our colleagues as to how high or low market rates will move, exhibiting humility is a more effective (and profitable) strategy when managing the institution’s cash and capital position.
As we always say at Darling Consulting Group, it is best to avoid speculation and “listen to what your balance sheet is telling you.” The prudent approach always evaluates your options with thorough analysis and comprehensive discourse of risk and rewards.
And for all of the angst and resistance to adding duration over the past 30 years, strategies to go long have unquestionably been the biggest winner. Those 30-year USTs at 7.5% in 1996 would still have five years left before maturity.
Darnell Canada is a managing director for CUES Supplier member Darling Consulting Group, Newbury, Massachusetts, a solutions firm that specializes in the area of asset/liability management for financial institutions. Canada works directly with C-suite executives helping them to understand the complexities of their balance sheet financial risks and providing guidance and unbiased advice on strategies that strengthen earnings performance. In addition to providing advice for margin improvement and risk mitigation, he helps financial institutions manage the rigors of challenging regulatory situations.
This article may not be reproduced or distributed without written permission from DCG.