
7 minutes
Executive compensation keeps pace with strong economy and industry gains.
Continued steady gains in the national economy and credit union industry helped set the pace for healthy salary and bonus increases for CEOs and other executives over the past year, according to the 2018 CUES Executive Compensation Survey.
Base salary and bonus increases for credit union CEOs averaged 7.3 percent over 2017, which is consistent with both strong gross domestic product growth and reports from the National Credit Union Administration of 5.9 percent annualized asset growth and 5 percent membership gains at federally insured credit unions for the first quarter of this year.
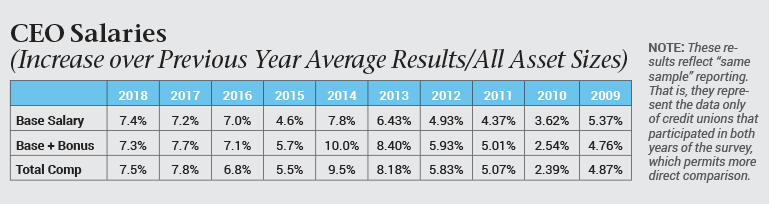 In lockstep with those trends, the average base plus bonus for CEOs across all asset ranges increased from $364,981 in 2017 to $391,749 in the same-sample survey (limited to credit unions participating in both years to more clearly indicate trends). Across the same sample, the average base salary for chief executives rose 7.4 percent to $328,485, and total compensation increased an average 7.5 percent to $397,661.
“That level of compensation is not surprising given the state of our economy, which has seen continual growth over the past five years,” says Michael Becher, CPA, vice president of Industry Insights, Dublin, Ohio, which administers the CUES survey. “But it’s obviously good news for credit union executives to see that their compensation is trending at a higher rate than the GDP [2.2 percent] and the annual WorldatWork survey,” which continues to come in at around 3 percent for raises across all positions and industries.
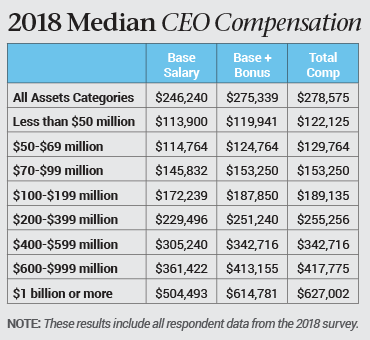
 Across asset categories, the 2018 CUES survey reports, average base plus bonus pay ranged from $117,031 among the CEOs of credit unions with less than $50 million in assets to $648,541 for the chief executives of $1 billion-plus organizations.
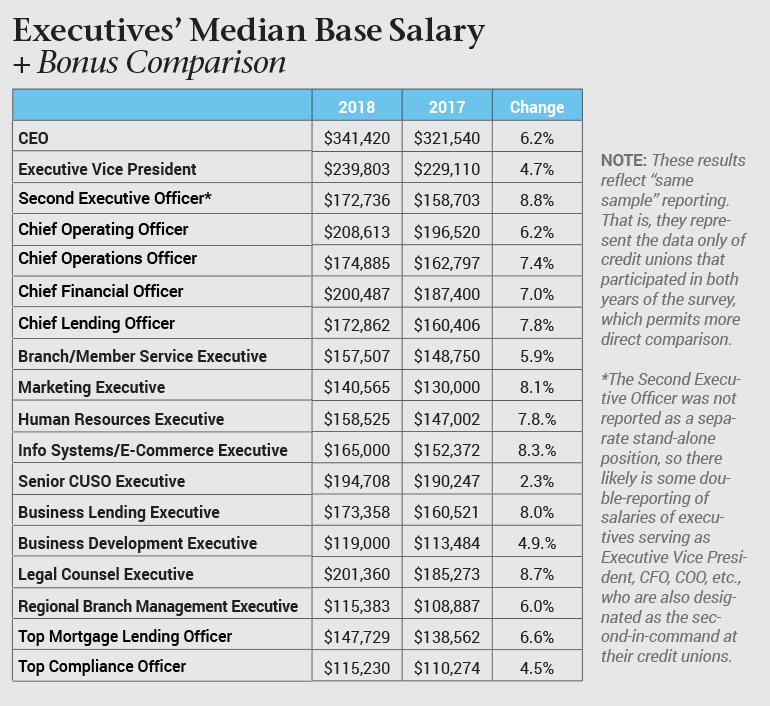
Most other credit union executives posted salary and bonus hikes above average in comparison to all U.S. business sectors as well. Median base plus bonus increases, from same-sample results, ranged from 2.3 percent for senior CUSO executives to 8 percent for business lending executives, 8.1 percent for marketing executives, and 8.8 percent for second executive officers.
Total compensation for members of the executive team ranged from a median of $241,803 for executive vice presidents (up 5.2 percent from 2017) and $211,722 for legal counsel executives (up 5.9 percent) to $119,755 for top compliance officers (up 4.6 percent) and $115,383 for regional branch managers (up 6 percent).
Bonus Pay Levels Off
CEOs of almost nine in 10 participating credit unions (87.7 percent, up from 84.4 percent in 2017) were eligible to receive bonuses over the past year. At 13.3 percent, the average bonus paid by participating organizations offering incentive pay seems in step with other compensation trends but is down from last year’s 16.8 percent.
 If that trend continues and incentive pay increases level off, it could be a sign of boards agreeing that the credit union movement has achieved a balance in executive salaries and bonuses, Becher suggests. Double-digit incentive awards calculated as a percentage of base salaries that have risen consistently in recent years still provide a healthy incentive.
“If you’ve had five years of steady salary increases, even a 5 percent increase in bonus based on salary is still really good. It’s based on a much larger number than where we were five or six years ago,” he notes.
A leveling off in bonuses might also reflect the pace of growth across the industry. “While we’re in a growth state, it’s slow and steady growth. That’s not bad. It allows organizations to better plan and budget for the future,” Becher adds. “It’s a good place to be, with base salaries finally reaching a level on par with others in financial services, so that credit unions don’t need to rely on bonuses so much.”
Bonus eligibility is most common among the largest credit unions: 97.7 percent of $1 billion-plus organizations offer incentive pay to their chief executives, in comparison to 75 percent of financial cooperatives with less than $50 million in assets. Bonuses as a percentage of base pay also vary according to asset size, ranging from 5.2 percent among the smallest credit unions participating in the survey to 24.1 percent at the largest.
The top factors in determining CEO bonuses were earnings (cited by 64.1 percent of participants), board evaluation (57.4 percent) and loan growth (52.5 percent). Though the rates have varied in small amounts from year to year, these factors have consistently topped survey responses for at least the last decade. Other factors include membership growth (23.2 percent) and satisfaction (22.2 percent), IDC’s CAMEL ranking (15.9 percent), and share growth (18.3 percent).
Moving to long-term benefits, 93.5 percent of responding credit unions offer 401(k) retirement plans for their CEOs; 44.5 percent have structured 457(b) plans; and 34.8 percent now offer 457(f) plans. A 457(b) plan permits executives to set aside more of their income to supplement retirement savings, while a 457(f) plan is an employer-funded deferred compensation program that a credit union might structure to reward and retain executives.
 There is increasing interest among credit unions in split-dollar life insurance plans as an alternative to or supplement for 457(f) plans, with 28.5 percent of respondents offering that deferred compensation benefit to their CEOs, up from 14.1 percent in 2014.
Employment Contract Practices
For the second year, the executive compensation survey included questions about CEO contracts. Almost half (45.7 percent) of participating credit unions have negotiated employment contracts with their chief executives. The most common lengths of those contracts are three years (37.1 percent), five or more years (32.9 percent), and one year (16.8 percent).
In terms of contract components, 83.2 percent of respondents reported addressing severance pay; 53 percent included change-in-control provisions (setting out the disposition of executive benefits in the event of a merger or major shift in board membership and direction); and 37.1 percent spelled out continuation of certain benefits post-termination. Less than a third of contracts (32.6 percent) offered by participating credit unions include a covenant not to solicit, which typically is structured to prohibit the departing executive from recruiting employees for a set period of time.
Transitions at the Top
In addition to economic trends, survey data align with national demographics as well, signaling an impending generational shift in the C-suite. Among CEO respondents, 81.6 percent have worked in the financial services industry for more than 20 years, up from 75.1 percent five years ago. Almost half (45.5 percent) are more than 30 years into their financial services careers.
As executives of the baby-boom generation retire in increasing numbers, some business sectors may see a downward trend in executive compensation as long-time leaders commanding salaries that recognize their many years of service are replaced with successors with salaries that reflect fewer years on the job, Becher notes.
Those transitions could have a ripple effect across the hierarchy of business organizations and across overall compensation levels, as newer executives, mid-level managers and employees hired to fill entry-level positions left open by a progression of promotions begin to amass on-the-job experience—and the salaries that come with that, he explains.
On the other hand, the combination of a strong economy, low unemployment and mass turnover at the top means credit unions will likely face stiff competition in executive recruitment. The bottom line is that “a lot of companies will be looking for good people,” Becher cautions.
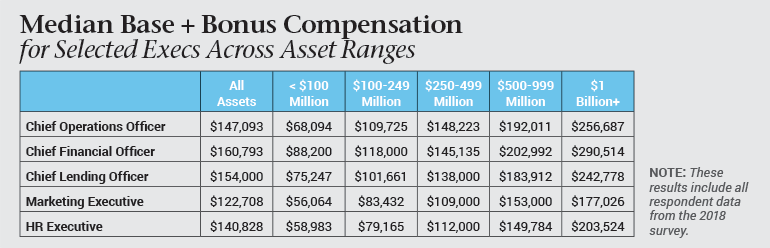
To ensure that they are offering compensation in line with top candidates’ expectations, credit unions should look past the executive summary of the CUES survey to dig into specific data, he recommends. As statistical modeling of the survey data demonstrates, a credit union’s asset size has the greatest influence on salary levels; this relationship is evident in the accompanying tables on CEO and other selected executive compensation by asset range. A specific search to narrow asset range can provide a clearer picture on competitive compensation offers, especially when combined with such search factors as years of experience and level of education.
Focusing geographically by region and size of metro market can help dial in more closely to market expectations for compensation offers that reflect relative cost of living, Becher notes.
Subscribers to the CUES survey can generate customized comparisons to peer aggregates based on asset size, membership base size, full-time equivalent employees, loan portfolio size, region, state, metro size of headquarters location and field of membership, among other options to filter data to assess compensation trends in their markets.
Karen Bankston is a long-time contributor to CU Management and writes about credit unions, membership growth, marketing, operations and technology. She is the proprietor of Precision Prose, Eugene, Ore.