
5 minutes
Work on the definitive answers to questions on these key areas to execute an informed financial strategy, not a speculative one.
Reprinted with permission from the Darling Consulting Group e-newsletter
A significant portion of balance sheet risk management revolves around interest rate risk. Therefore, you would think some of the most important questions right now are when and how much rates may rise and the variables that could impact those outcomes (strength and speed of recovery, inflation, etc.). With the recent bond market sell-off, continued improvement in economic conditions, vaccination rollout and significant fiscal stimulus there is plenty to speculate on when it comes to the timing and magnitude of the next rising rate cycle.
At Darling Consulting Group, we are not in the business of predicting rates or timing markets; however, that does not change the fact that we are all entitled to our opinions! Lively office bets on different points of the yield curve have a long history within our walls. Wagers can vary from a crisp $100 bill, a bottle of fine wine or simply bragging rights. It was only a short time ago we were glued to our computer screens as we watched the 10-year Treasury fall below 1%, resulting in another office winner and loser. Who would have thought the same bet could have been won in reference to the 30-year Treasury as well (.99% on March 9, 2020)? Luckily, at DCG, we are not in the gambling business. We are in the business of quantifying risk, evaluating tactical options and helping our clients execute informed balance sheet strategy.
The amount of inflation, the strength of the recovery, when rates will rise and by how much all have impacts on our balance sheet performance. However, trying to answer the specifics is much closer to making a bet than strategic planning. While fun to debate, how much of your success do you want to place in the hands of a bet—or would we be better served understanding the impacts of potential outcomes? Let's focus on questions we can definitively answer to increase our chances of success. I encourage you to walk through the balance sheet questions below and answer each item before placing your chips on the table.
Eight Focus Areas
Investments: Do you know the change in gain/loss of your investment portfolio relative to different rate movements? Are there some investments that have more price volatility than others? Are you comfortable with the answers produced? How do cashflows (prepayments) on mortgage-related bonds change the IRR profile and the overall yield on the securities depending on the premium or discount at which they were acquired, and are your models capturing these dynamics? How much of your portfolio is in cash or floating-rate instruments dependent upon future Fed tightening?
New Loans: What is the mix of new loan originations, floating vs. fixed? What points of the yield curve are most influential to pricing? Is current market liquidity and/or competition impacting spreads? What has been the historical trend of our loan spreads through different rate cycles? On adjustable-rate loans, what is the relationship between spreads and floors? How might higher rates impact new volume?
Existing Loans: For fixed-rate loans in the portfolio, how much could cashflows (prepayments) change as rates go up? For floating-rate loans, how much of the portfolio has floors that are current in the money (index + spread below floor rate), and what is the amount indexed rates must go up before we break through the floor and actually derive a benefit from higher rates? If utilizing an institution index (bank prime), what is the strategy and plan to move higher? Are your models capturing all these dynamics?
Deposit Surge: How have your deposit balances and mix changed since March of 2020, and how has that impacted your IRR profile? While the amount of future deposit balances remains one of the questions leaders of financial institutions struggle to answer definitively, it is imperative to comprehend the influence on the range of potential outcomes (continued growth, shifts in mix, significant outflows).
Non-Maturity Deposit Pricing: Have you done regression analysis to see how well your deposit pricing is correlated with movements in short-term rates? Have you observed trends or changes through more than one rate cycle? Do those pricing changes occur in a linear or nonlinear fashion? How much can you rely on historical pricing, and do you understand the impact of NMD pricing becoming more or less rate sensitive in the future?
Time Deposits: What is your strategy for pricing your CD curve? Is it proactive or reactive in your market? Do you price based on current balance sheet needs for IRR management (targeting specific terms) or do you follow market rate pricing (Treasury/Federal Home Loan Bank/brokered)? What terms make up the majority of your CD balances? Does this change throughout rate cycles? We often experience a shift to shorter terms or more liquid NMD accounts in low-rate environments. Have you quantified the impact of balances shifting back as rates go up?
Wholesale: Current market liquidity has reduced the borrowing position for most institutions; however, this is another tempting area to bet, with the idea of locking in longer-term funding before it becomes more expensive. Rather than speculating on market timing, what term funding does your balance sheet require from an IRR perspective? How has this changed since March of 2020 given the deposit surge and cash build-up the industry has experienced? What should be done with legacy funding at higher rates?
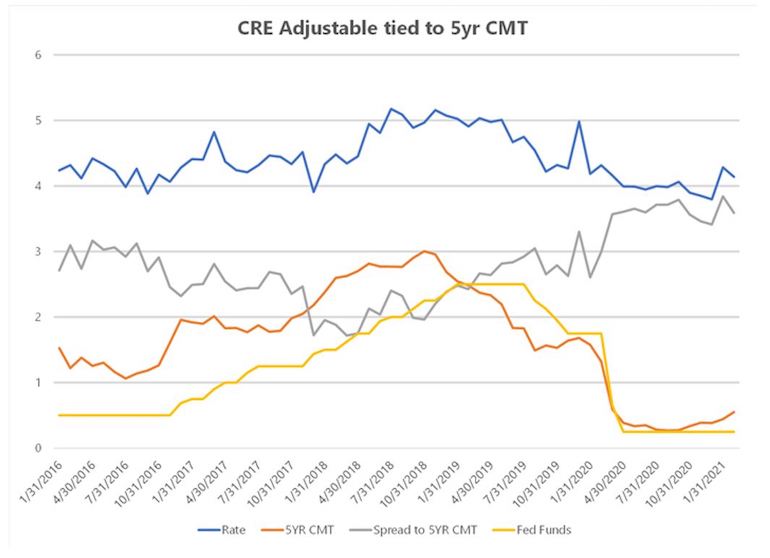
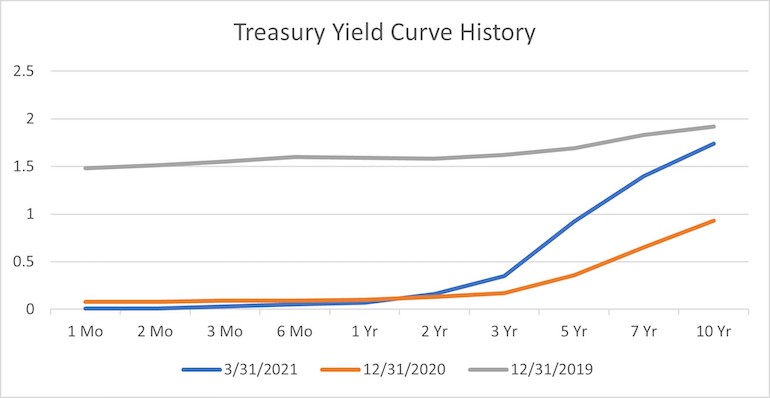
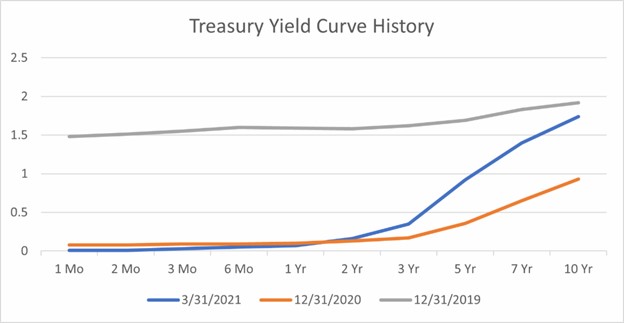
Rates: Do you have a strong understanding of the relationship between balance sheet performance and the shape of the yield curve? In recent history, we have seen extremes from an inverted curve, historically low levels across all terms as well as the most recent curve steepening. What points matter most to your balance sheet, as mentioned above, regarding both loan and deposit pricing?
Without the answers to the questions above, you might as well just place your bet on the table blindfolded. You could even be inadvertently doubling down on a position rather than balancing your risk profile. Rarely does the futures market, the Treasury curve, and/or the Federal Reserve hit the jackpot when forecasting rates. Betting on rates is a game seldom won. However, when you bet on your balance sheet, you never lose.
Michael Mitchell is a director at Darling Consulting Group, a CUES Supplier member based in Newburyport, Massachusetts. In this role, he leverages his passion for the asset liability management process to maximize strategic effectiveness, manage risk and optimize income. Advising executive teams for institutions all over the country, Mitchell provides tailored, thought leading solutions in an ever changing economic and regulatory environment. He has been with DCG since 2006 and is a graduate of University of New Hampshire with a degree in finance. When not talking ALM, Mitchell can be found hiking, biking and skiing with his family in the mountains of New Hampshire.